


Sorting the rough from the smooth with your drivers
In a brand new series of technical insights OptimumG president Claude Rouelle Focues on a race driver's key performance indicators - kicking off with steering wheel smoothness
BY CLAUDE ROUELLE
Download the original PDF from RaceCar Design Magazine!
Just how do you measure, compare and improve racing drivers? In this new series we will be addressing that very question; looking at driving style and how th is relates to driver performance. This first article will discuss the drivers' steering wheel smoothness, and our first stop is with the data acquisition.
Data Acquisition
A vehicle's data acquisition system is composed of an electronic memory device that stores values
measured from the vehicle's sensors as a function of time. The data acquired can then be processed
for further analysis.
The data collected can be divided into three main categories: the vehicle's vital signals, vehicle performance, and driver performance. The vehicle's vital signals are all the channels related to reliability. The channels that are typically included are: engine oil pressure and temperature, water
temperature, fuel pressure, gearbox and differential temperature, battery voltage, engine rpm, lambda, exhaust gas temperature, etc.
Vehicle performance channels are parameters that are vehicle dynamics related, channels such mas: vehicle speed, accelerations, damper position, tyre temperature and pressure, ride height, suspension loads, tyre loads, side slip angle, yaw velocity, engine speed, etc.
Driver performance channels are parameters that the driver controls, such as throttle, brake and steering position, and gear position.
The vehicle vital signals are the most important and should be checked first before making
any additional analysis. Driver performance channels can tell us how the driver is performing on
track. Vehicle performance channels help us understand what the vehicle is doing with the different set-up changes. But the biggest challenge for any data acquisition engineer is how to process all this data in the minimum amount of time.
Measuring up
Key performance indicators (KPIs) help achieve this objective as they represent a type of performance measurement. These metrics can be the maximum, minimum, average, deviation, etc., of a channel.
KPIs allow us to reduce the amount of data and get it to the engineer so they can quickly extract and visualise mindful data, which makes it easier to interpret numbers and highlight relationships. The goal is to find patterns, optimums, predictions, deviations, etc.
Being able to process, filter, and visualise data is an essential part of data-driven engineering. It is not only about efficient analysis but also about quickly making the right decisions on the car set-up and, sometimes, to make the driver attentive to some of their driving habits that they may want to modify.
A good data or performance acquisition engineer will first observe and compare, and then draw conclusions. It is very common for an engineer to look at the data and then immediately make a conclusion. The first question they need to ask themself is: are we looking at the cause or the effect? KPIs will help guide the data engineer to look at the right data.
The steering wheel is one of the driver controls that has a direct relationship with the heading of the vehicle. Turning the steering wheel requires the driver to have a certain amount of smoothness as to not unbalance the vehicle. How the driver reacts from the feedback given by the vehicle and steering wheel will reflect on how fast they will turn the steering wheel.
There is a strong coherence and correlation between the steering wheel angle and vehicle response. If the driver applies corrections, something is not happening as they expected, or as it should be.
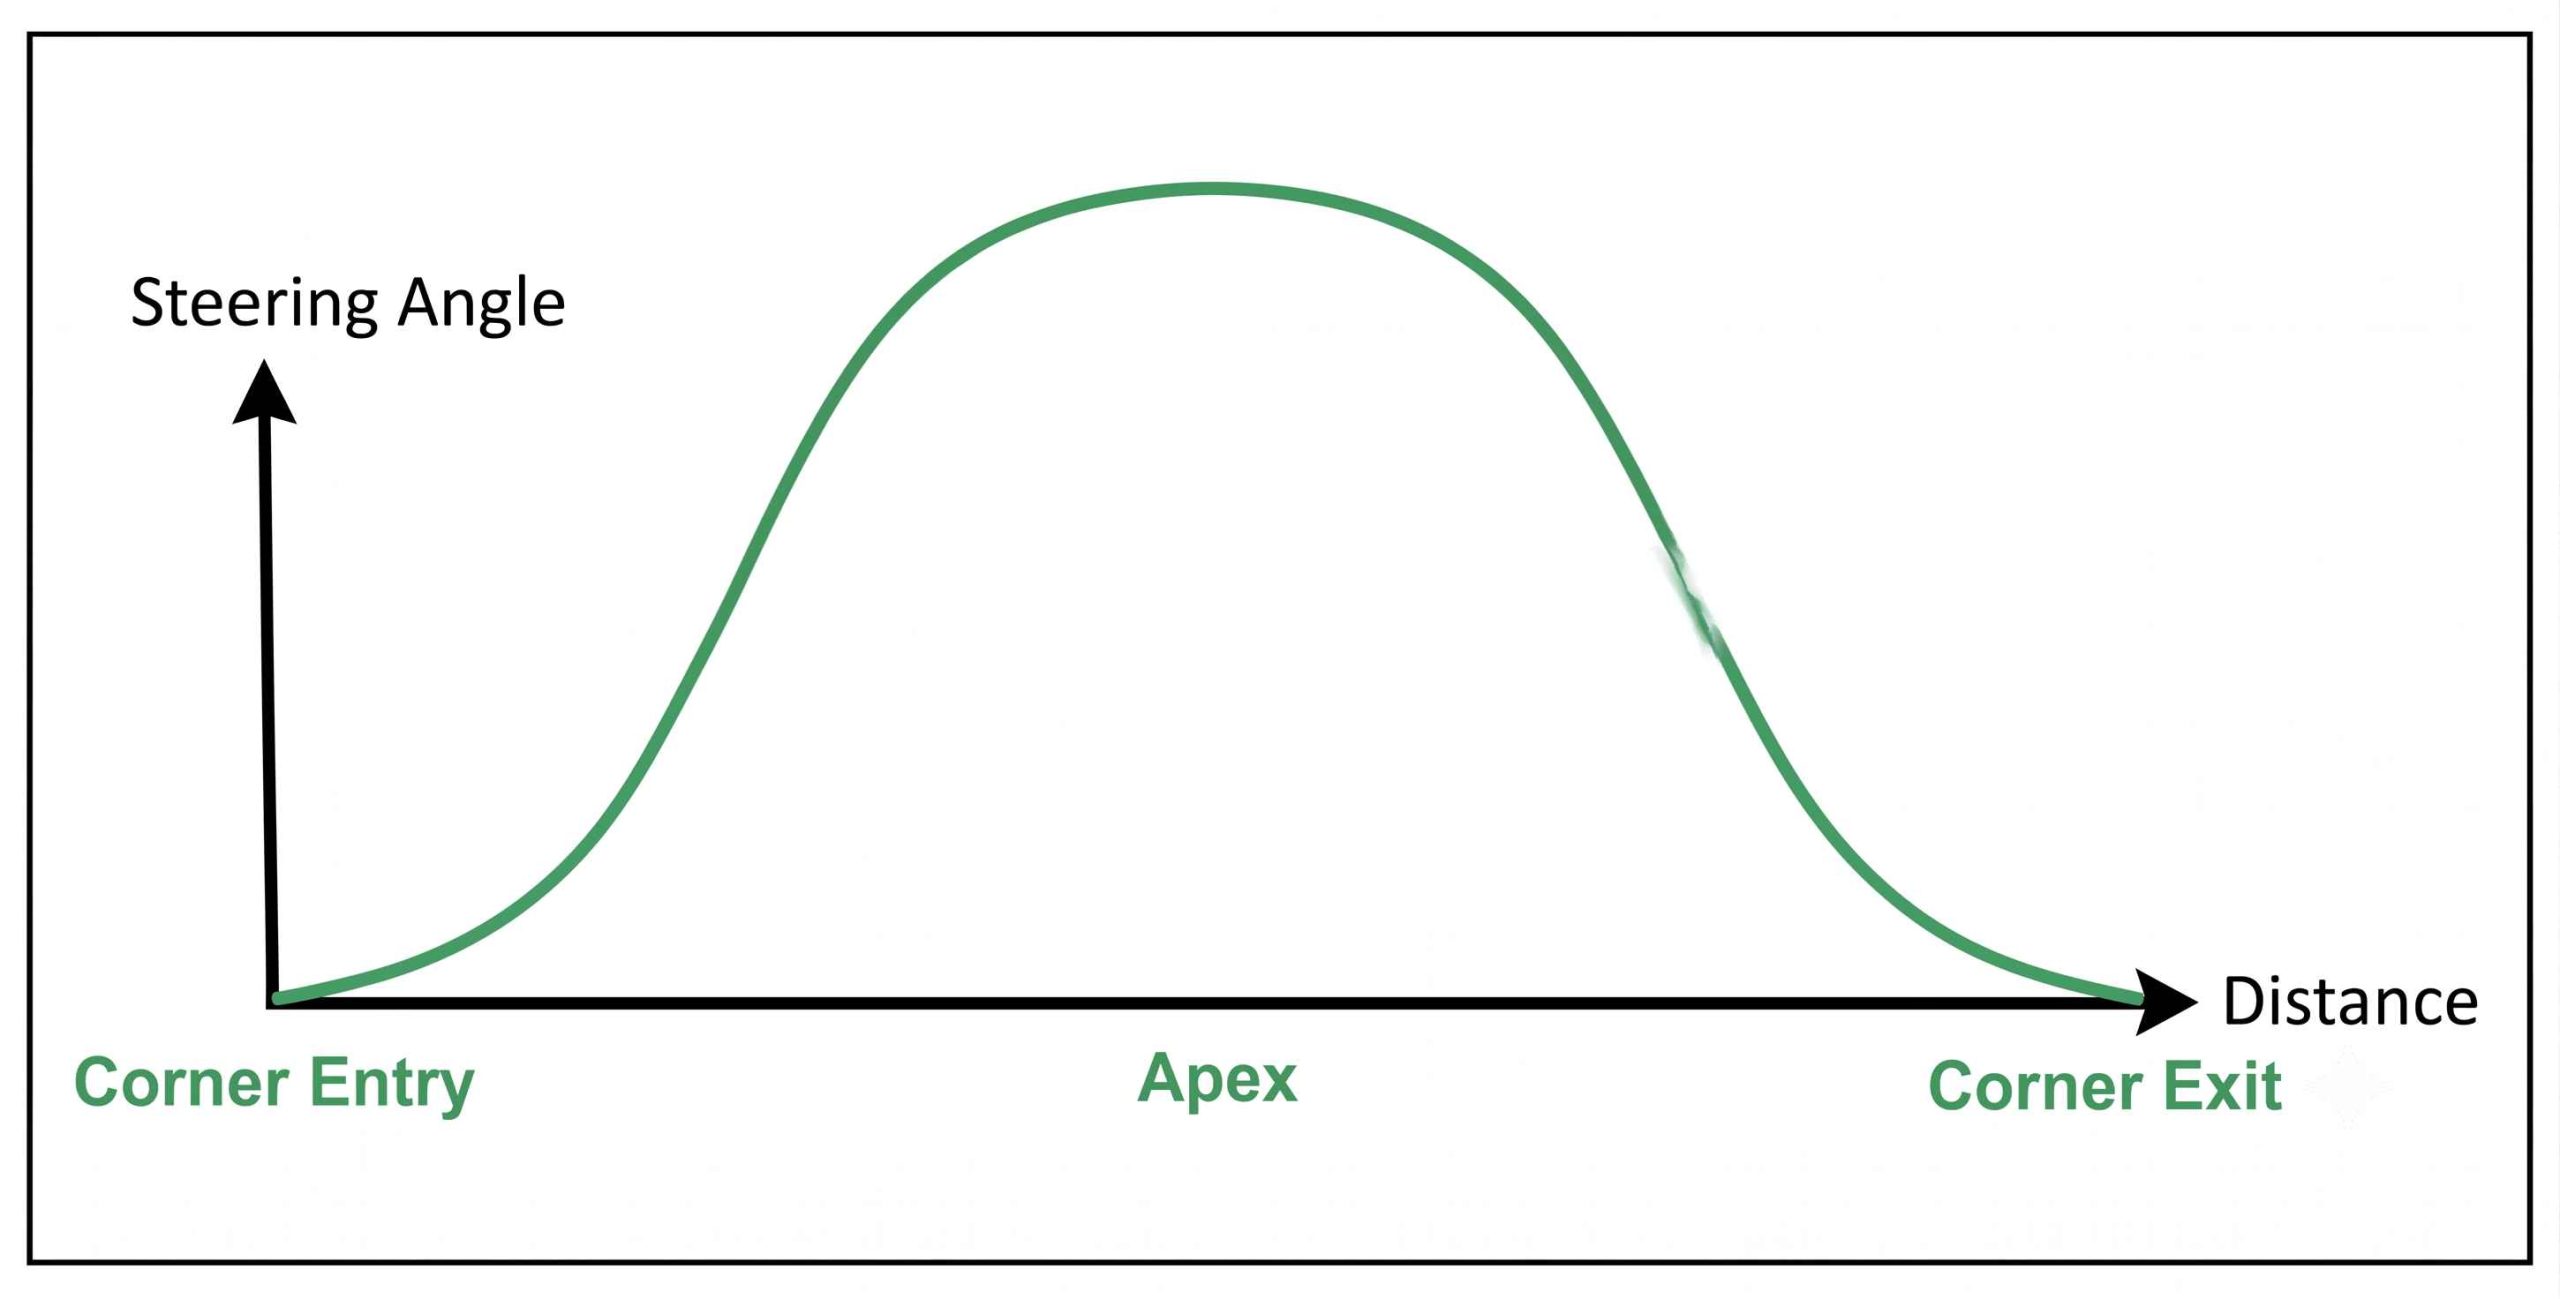
In a perfect world, with a perfect vehicle, race driver, and track, the steering wheel angle, for a constant radius corner, would be the one presented in Figure 1.
Here the driver brakes at the ideal braking point, turns the wheel with the necessary amount of steering at the exact steering speed, generating the maximum tyre lateral force, upon reaching the apex; no corrections or small increments of steering are necessary to have the tyres at their peak. After the apex, the driver returns to zero steering angle by applying the same amount of steering and steering speed.
Figure 1: This shows a theoretical steering wheel signal in a perfect world
Driver performance channels are parameters the driver controls
Reality check
In fact, the real steering wheel angle signal doesn't correspond to the idealised signal of Figure 1. The signal will be fuzzy, with variation in amplitude and frequency resulting from corrections of the driver due to the track grip/bumpiness and balance changes. Figure 2 shows the real data acquired from a steering wheel angle sensor in a corner.
Figure 2: Real steering wheel signal acquired from an angle sensor in a turn
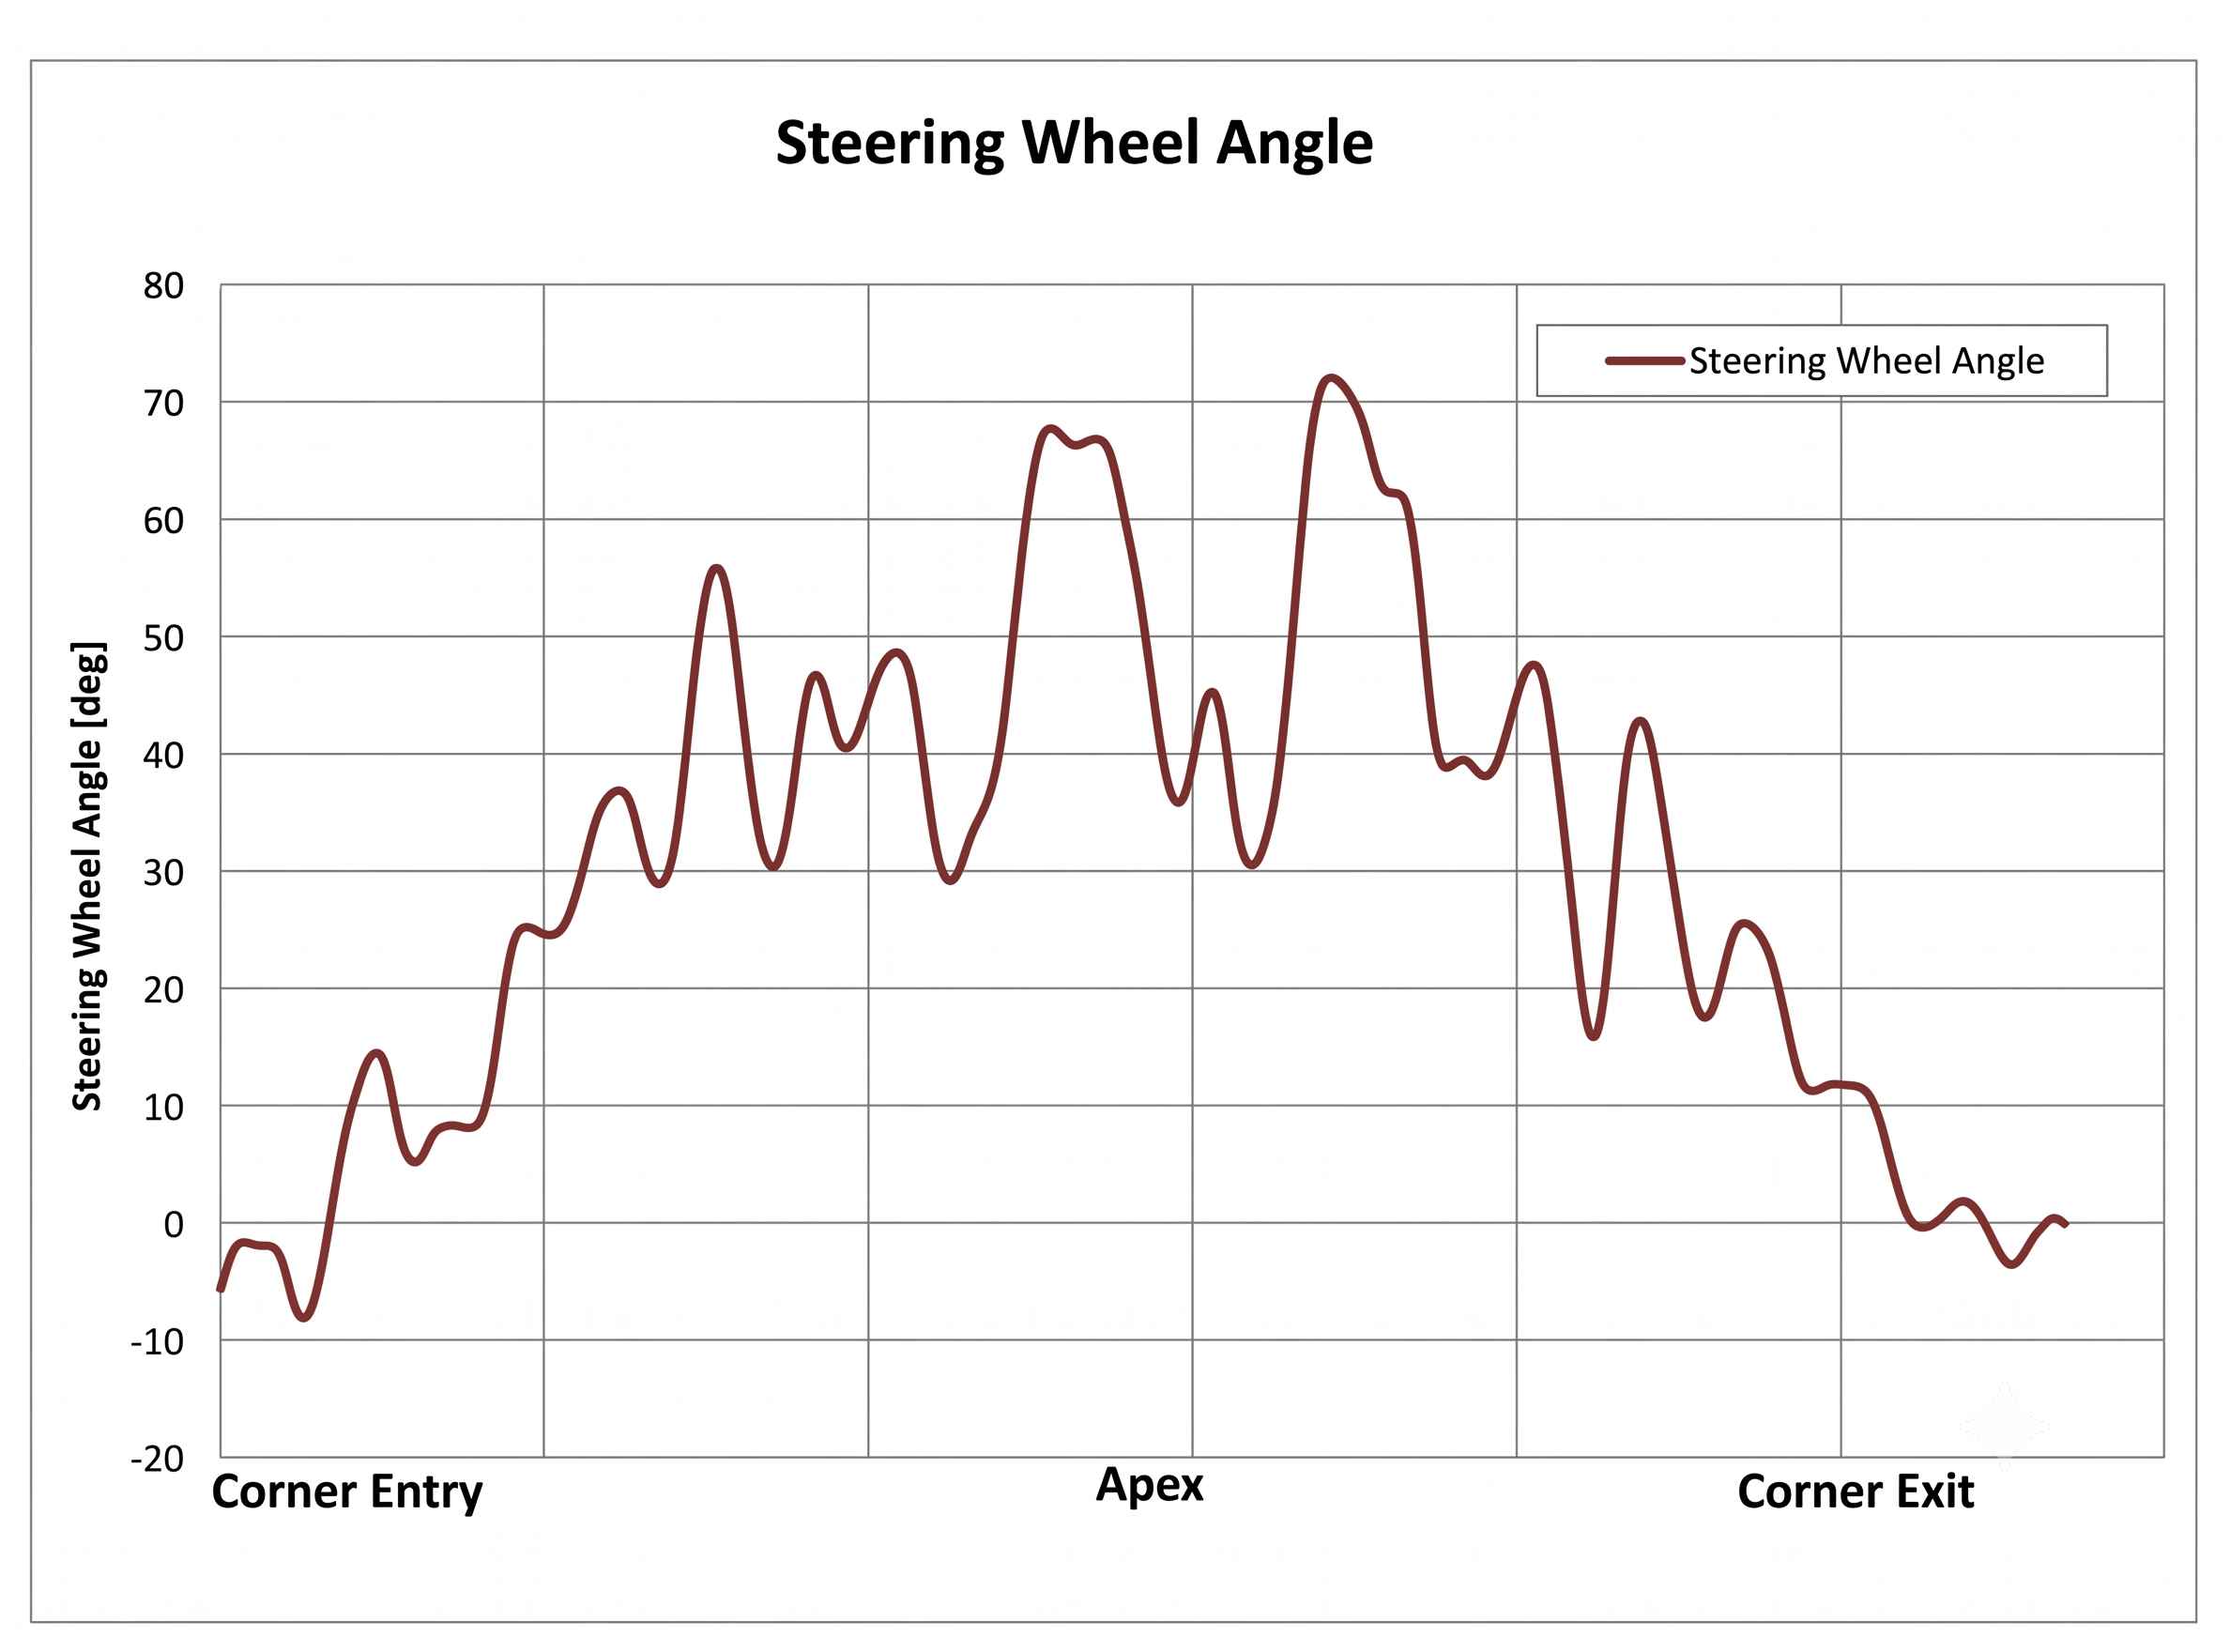
This discrepancy between theory and reality is due to track irregularities, driver input, tyre wear, car balance correction etc. The only feedback that the driver has is the steering feedback given from the front wheels' self-aligning torque. Any variation of the steering wheel will provide an idea of how much grip or yaw moment is still available (that is the sensing part of the control loop driver input - car behaviour) which will cause the driver to counter steer, for example, to correct for oversteer.
By combining the idealised steering wheel angle with the actual steering angle, we can create the steering smoothness channel. This metric comes from filtering (smoothing) the raw steering wheel angle channel to obtain a smoothed steering data, as can been seen in Figure 3, where we are comparing the actual steering wheel angle (in red) against the steering angle smoothed (in orange).
The smoothing is done by applying mathematical filters such as a moving average or using a low pass filter. In the case of analysis software, MoTeC i2, we can filter the data by using the Smooth filter (see Table 1).
This applies a moving average to our data. The user can then decide how they want to filter the data, using time or number of points.
Table 1: Math channels equations to create the steering smoothness KPI
| Maths channel name | Maths channel equation |
|---|---|
| Steered angle smooth | smooth('Steering Wheel'[deg], 1.0) |
| Steering smoothness | abs('Steering Wheel'[deg]-'Steered Angle Smooth'[deg]) |
| Steering smoothness KPI | stat_mean('Steering Smoothness'[deg], 1, range_change("Outings:Laps")) |
Efficiently being able to process, filter and visualise the data is an essential part of good data-driven race engineering
Smooth operator
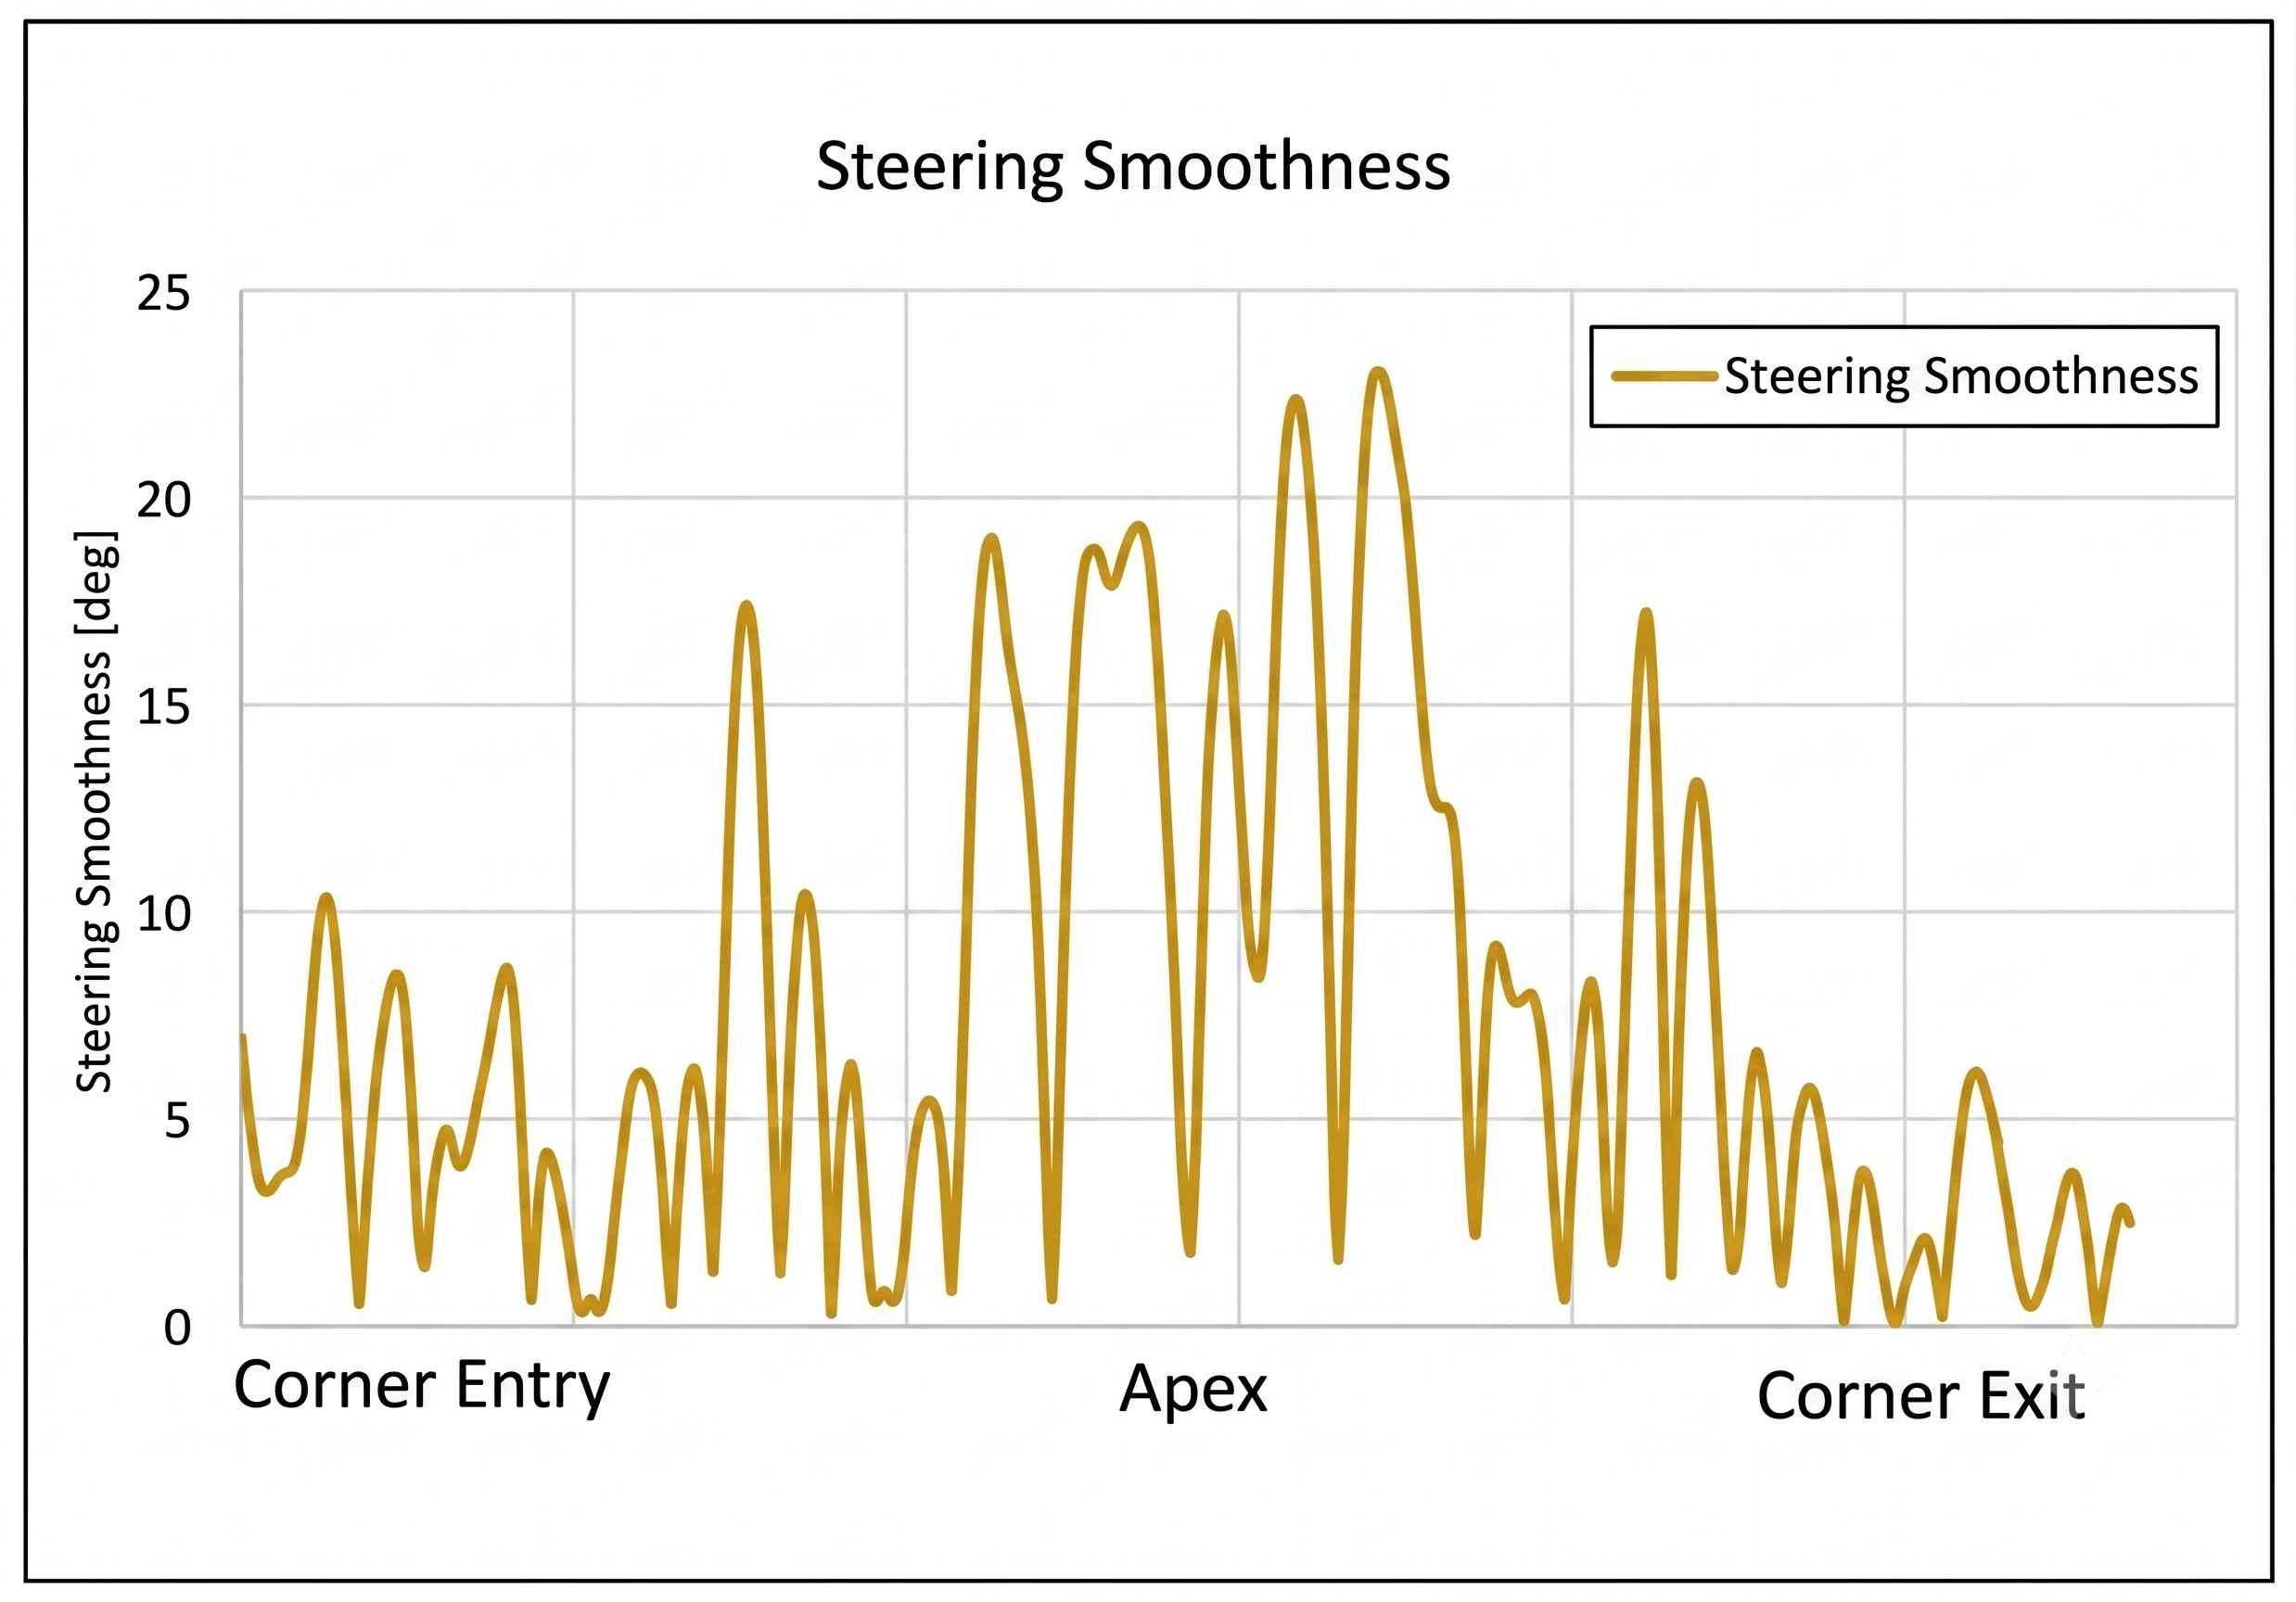
We can then calculate the steering smoothness (Table 1), which is the difference between the steering wheel angle and the steering wheel angle smoothed. The abs function is used for the case where the real steering signal is below the smoothed signal, since this would give a negative value and cancel out the positive values when calculating the average.
Additionally, for the steering smoothness KPI we are not interested if the driver is over- or under-correcting their steering. This kind of analysis is part of another KPI. The result of this operation is presented in Figure 4.
A vehicle with handling problems will require the driver to make more steering corrections. This is observed in Figure 3 and Figure 4, particularly at the apex. This can be an indication that the driver is having problems with the vehicle balance mid-corner.
Figure 3: The original steering wheel angle alongside the smoothed angle
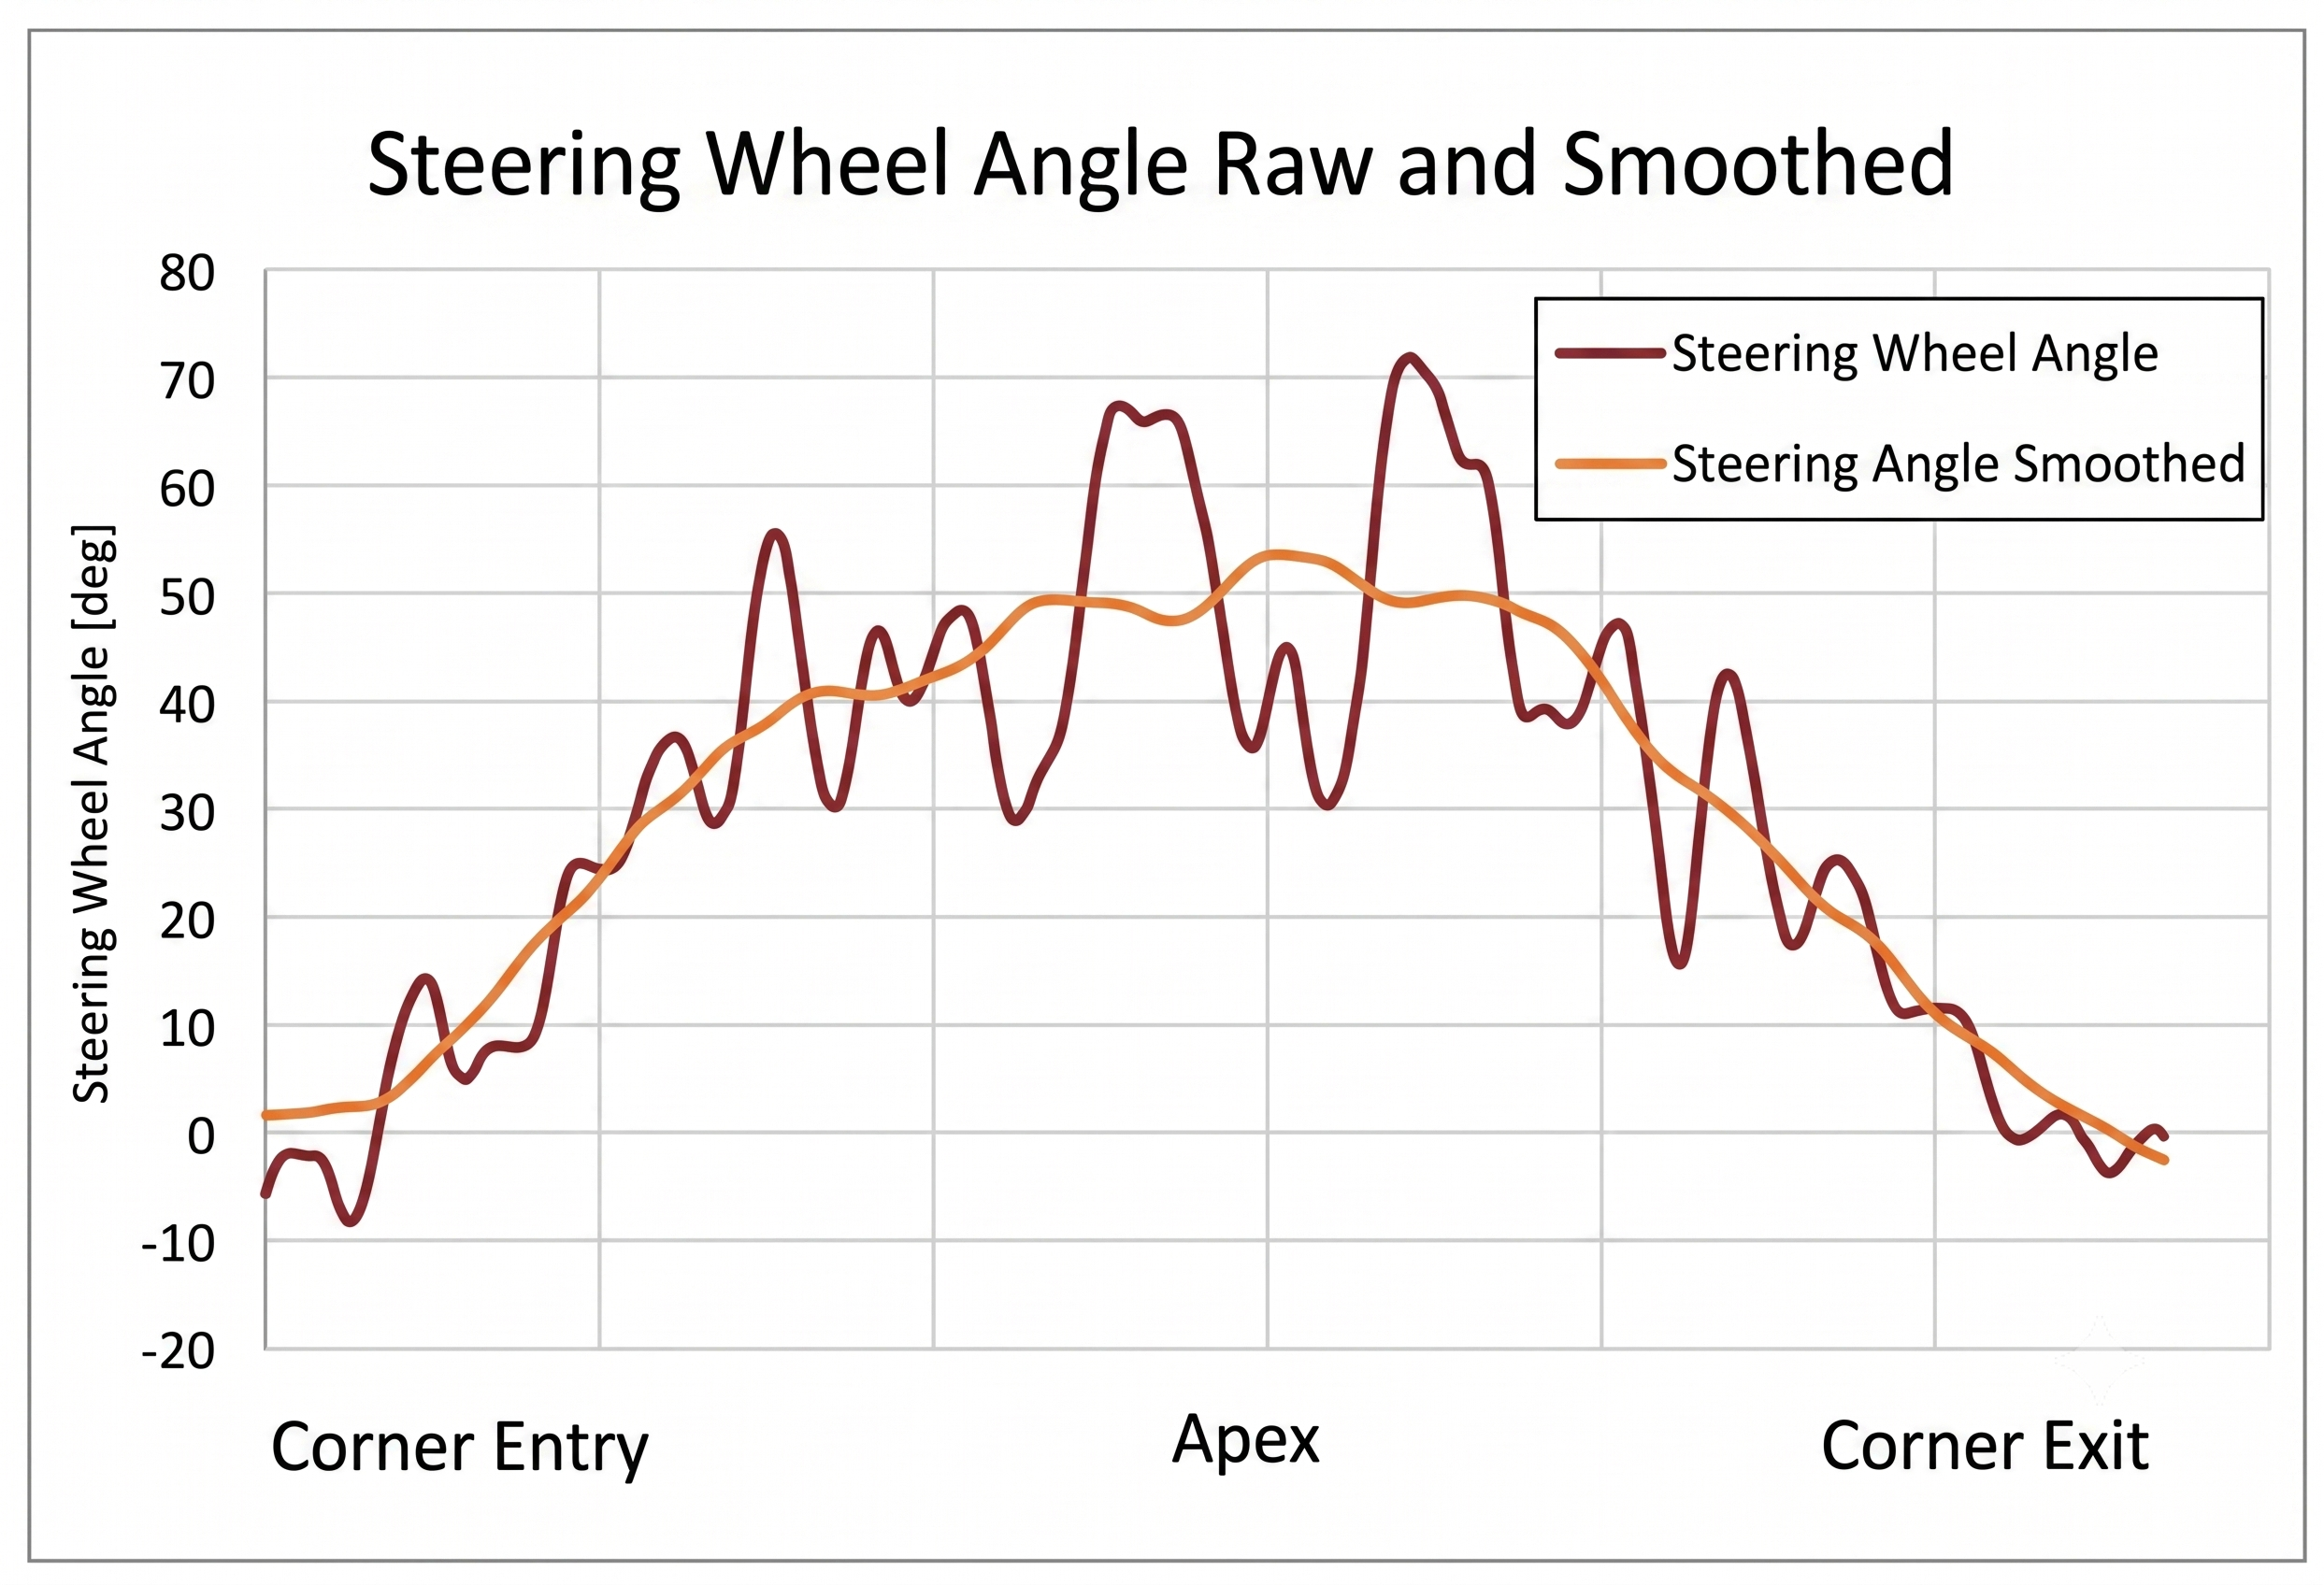
Figure 4: Steering smoothness when applied to under- or over-correction
A handling problem will mean the driver makes more corrections
After calculating the steering smoothness, we can then calculate the steering smoothness KPI for each lap by calculating the average of the steering smoothness, to obtain a statistical value as a measure of the steering smoothness (Table 1). The lower the average value, the fewer corrections the driver applies to the steering wheel.
Using the previous defined KPI, we are now going to look at the steering smoothness of three race drivers. The data is taken from three professional drivers lapping on the same race circuit.
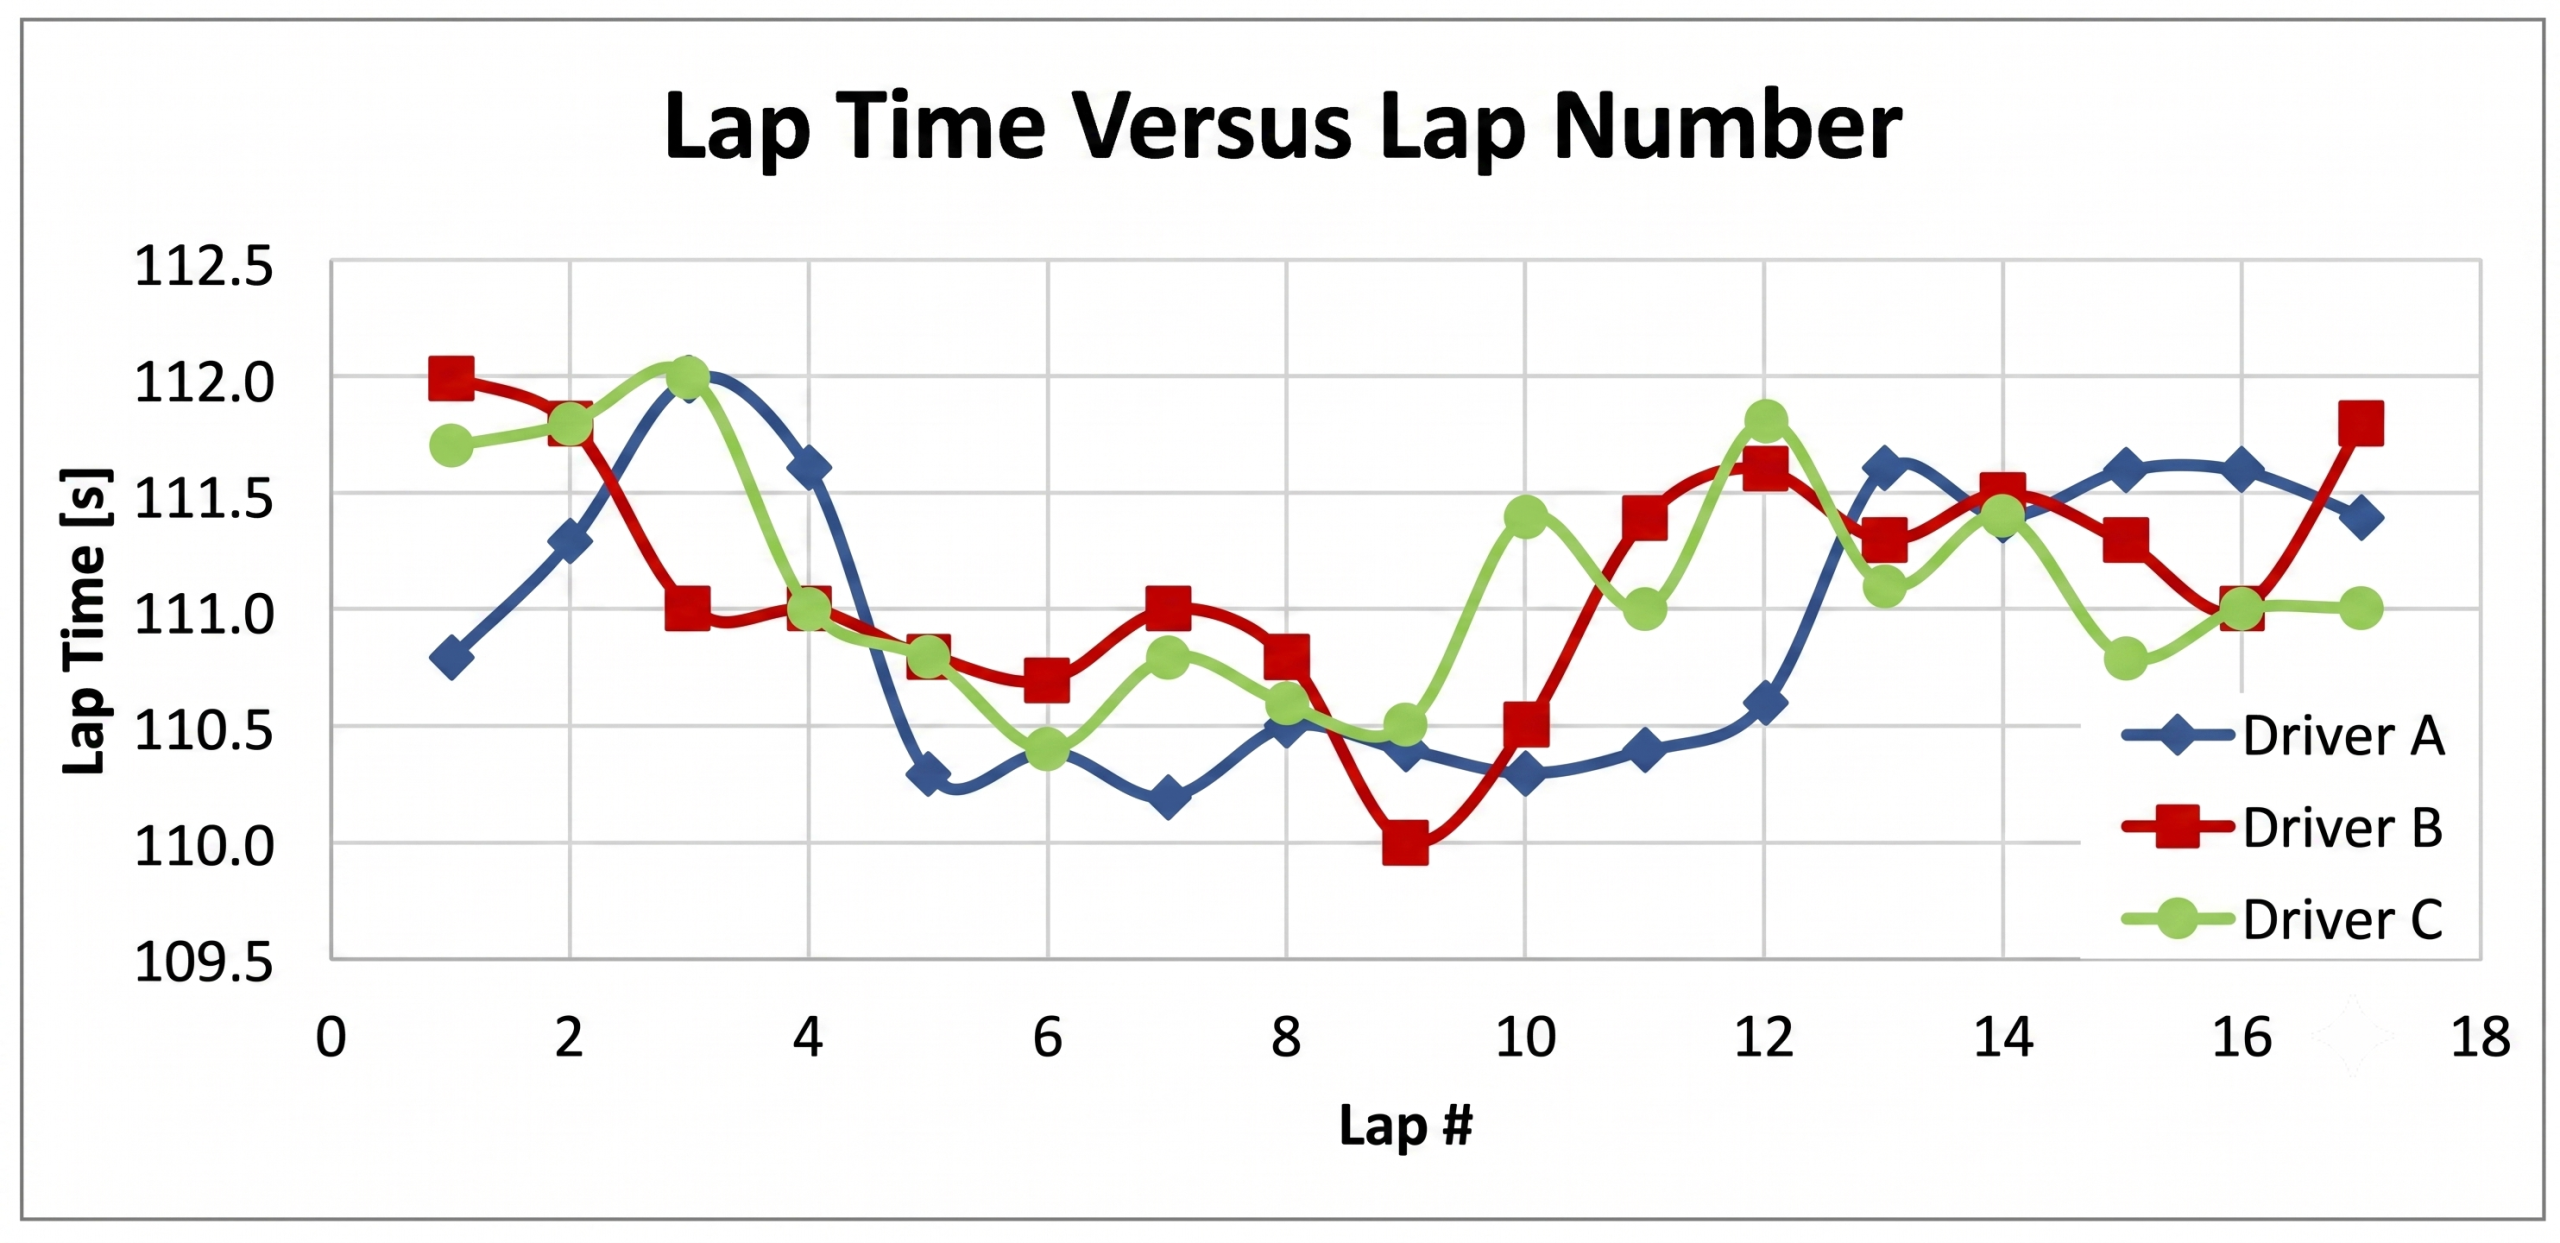
Figure 5 shows lap time versus the lap number. The fastest laps of each driver are respectively: Driver A, lap seven; Driver B, lap nine; and Driver C, lap six. Driver A has more consistent lap times and is normally faster than drivers B and C, even though driver B achieves the fastest lap. As the session progresses, the lap times increase for all drivers, possibly due to tyre wear.
Figure 5: Lap Time verus lap number for our three race drivers
Smooth operator
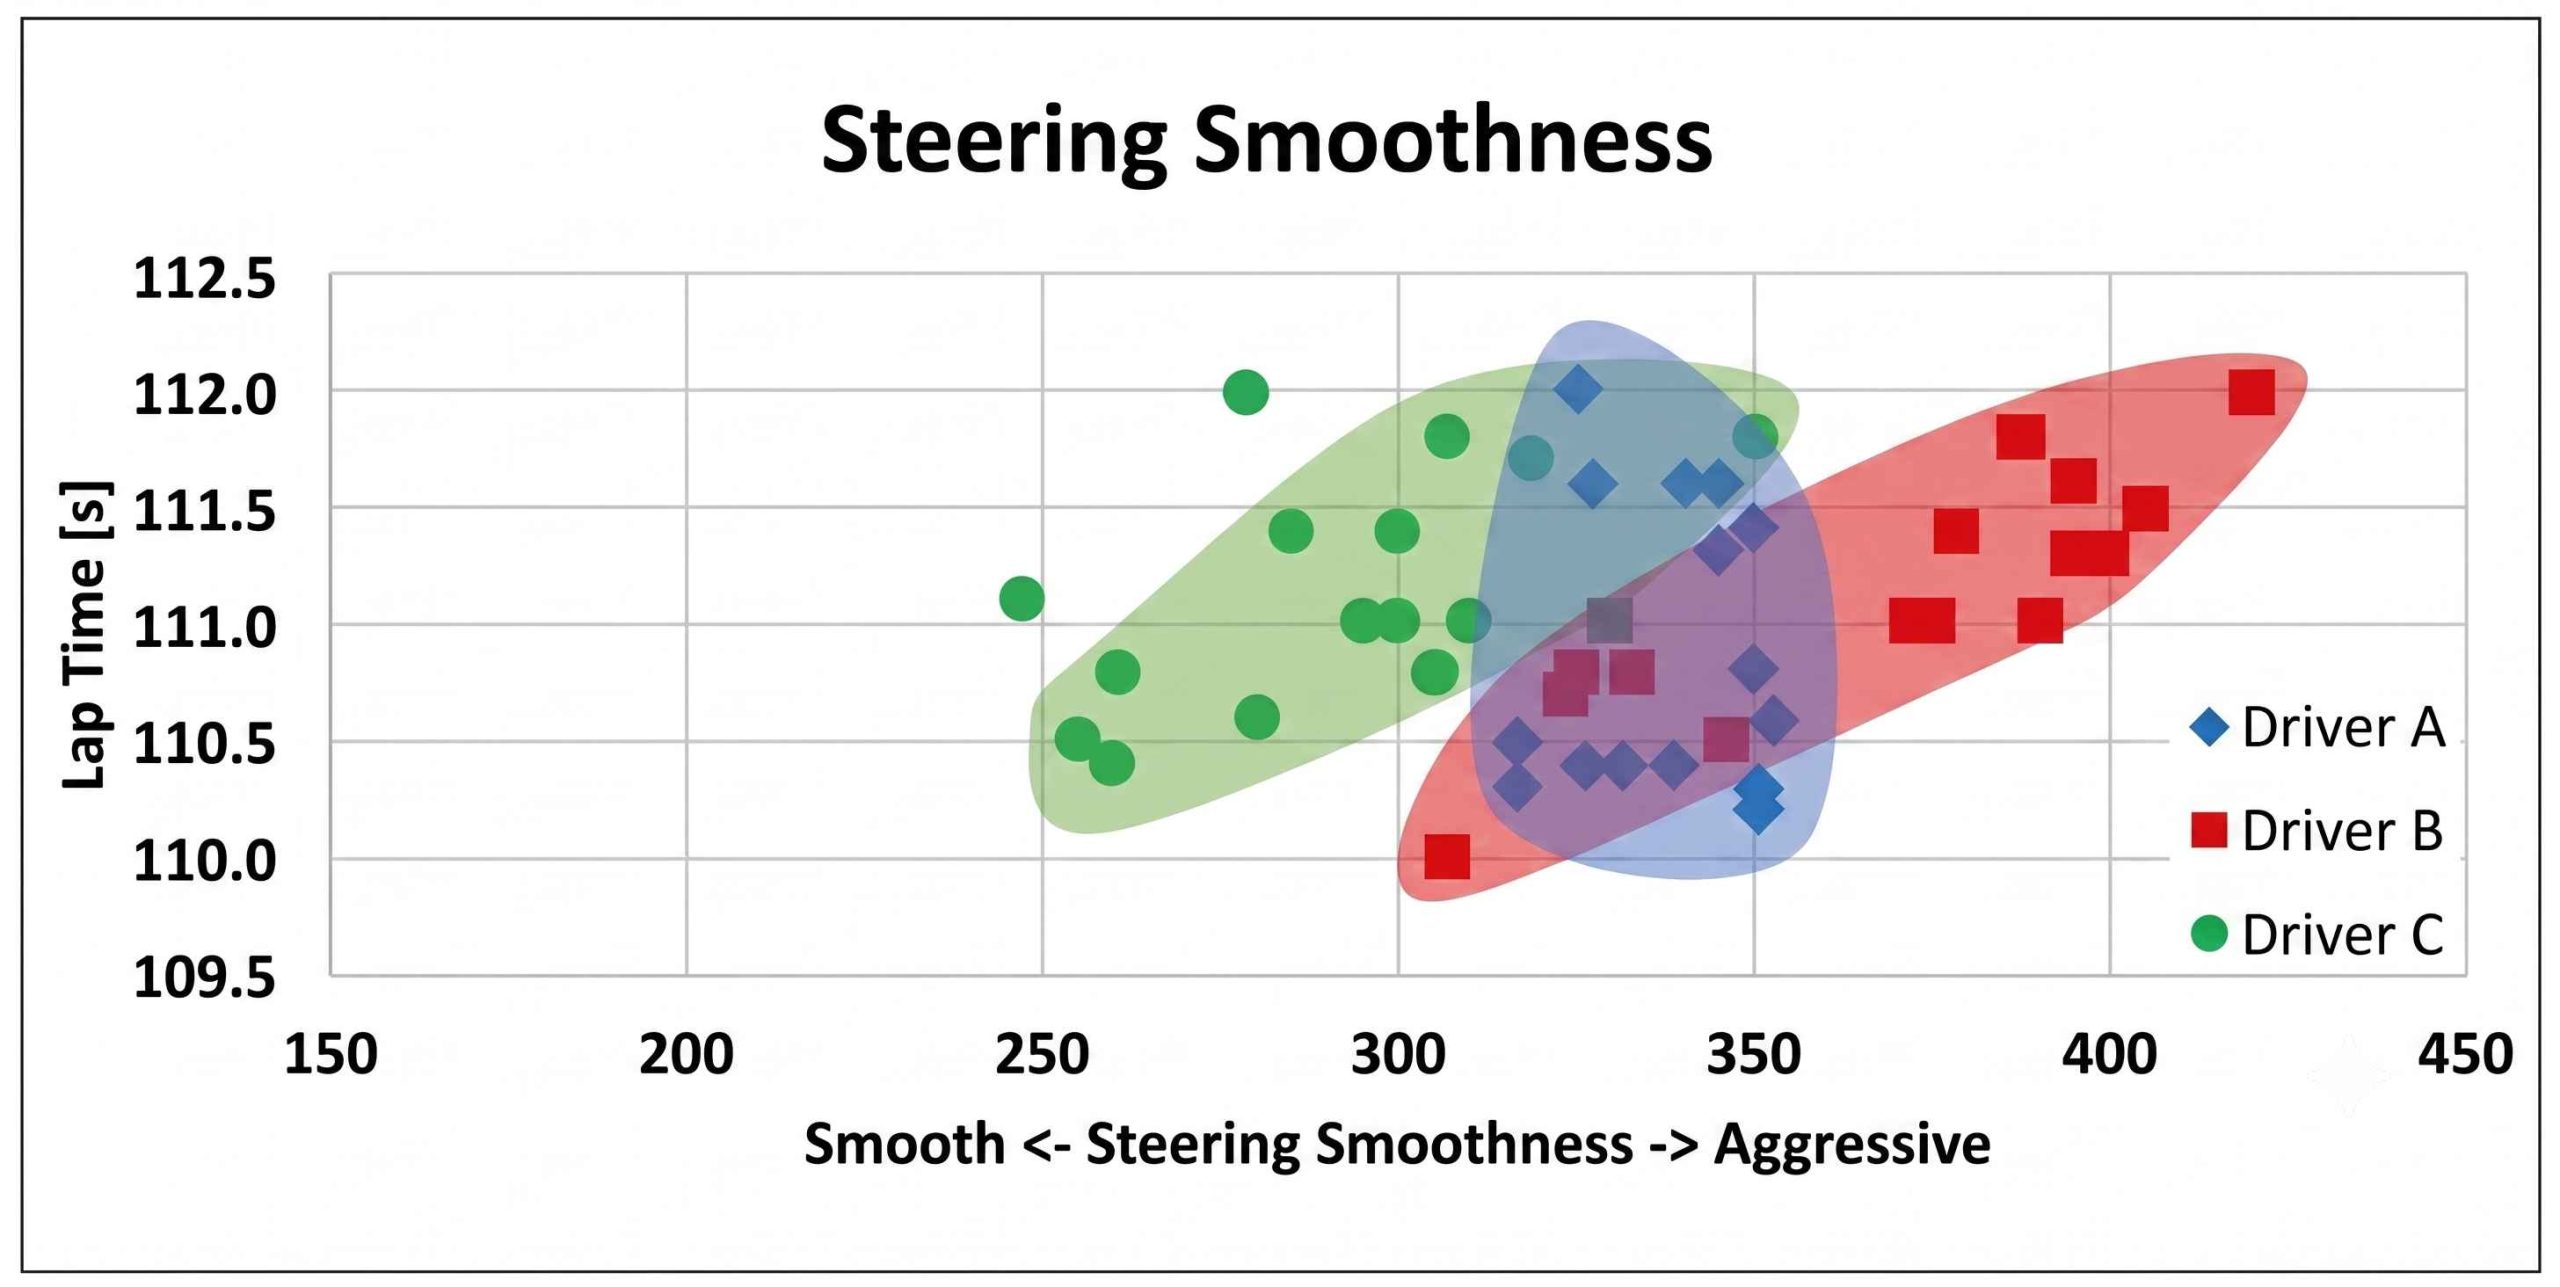
Figure 6 shows that driver A is the most consistent (less variation of the steering smoothness, which implies that there are fewer corrections of the steering wheel). Driver B and C have a higher variation of the steering smoothness, and there is a clear correlation between the lap time and the steering smoothness. The smoother both drivers are, the better the lap time. Driver A also seems to have a correlation between smoothness and lap time, but it is more difficult to see. Depending on the type of driver, there will be a stronger/weaker relationship.
Figure 6: Steering smoothness versus lap time for our drivers
The trick is to find what works best for you and your team
Progression
Instead of displaying the steering smoothness KPI versus lap time, it can also be displayed versus the lap number (Figure 7).
Figure 7: This shows steering smoothness versus lap number
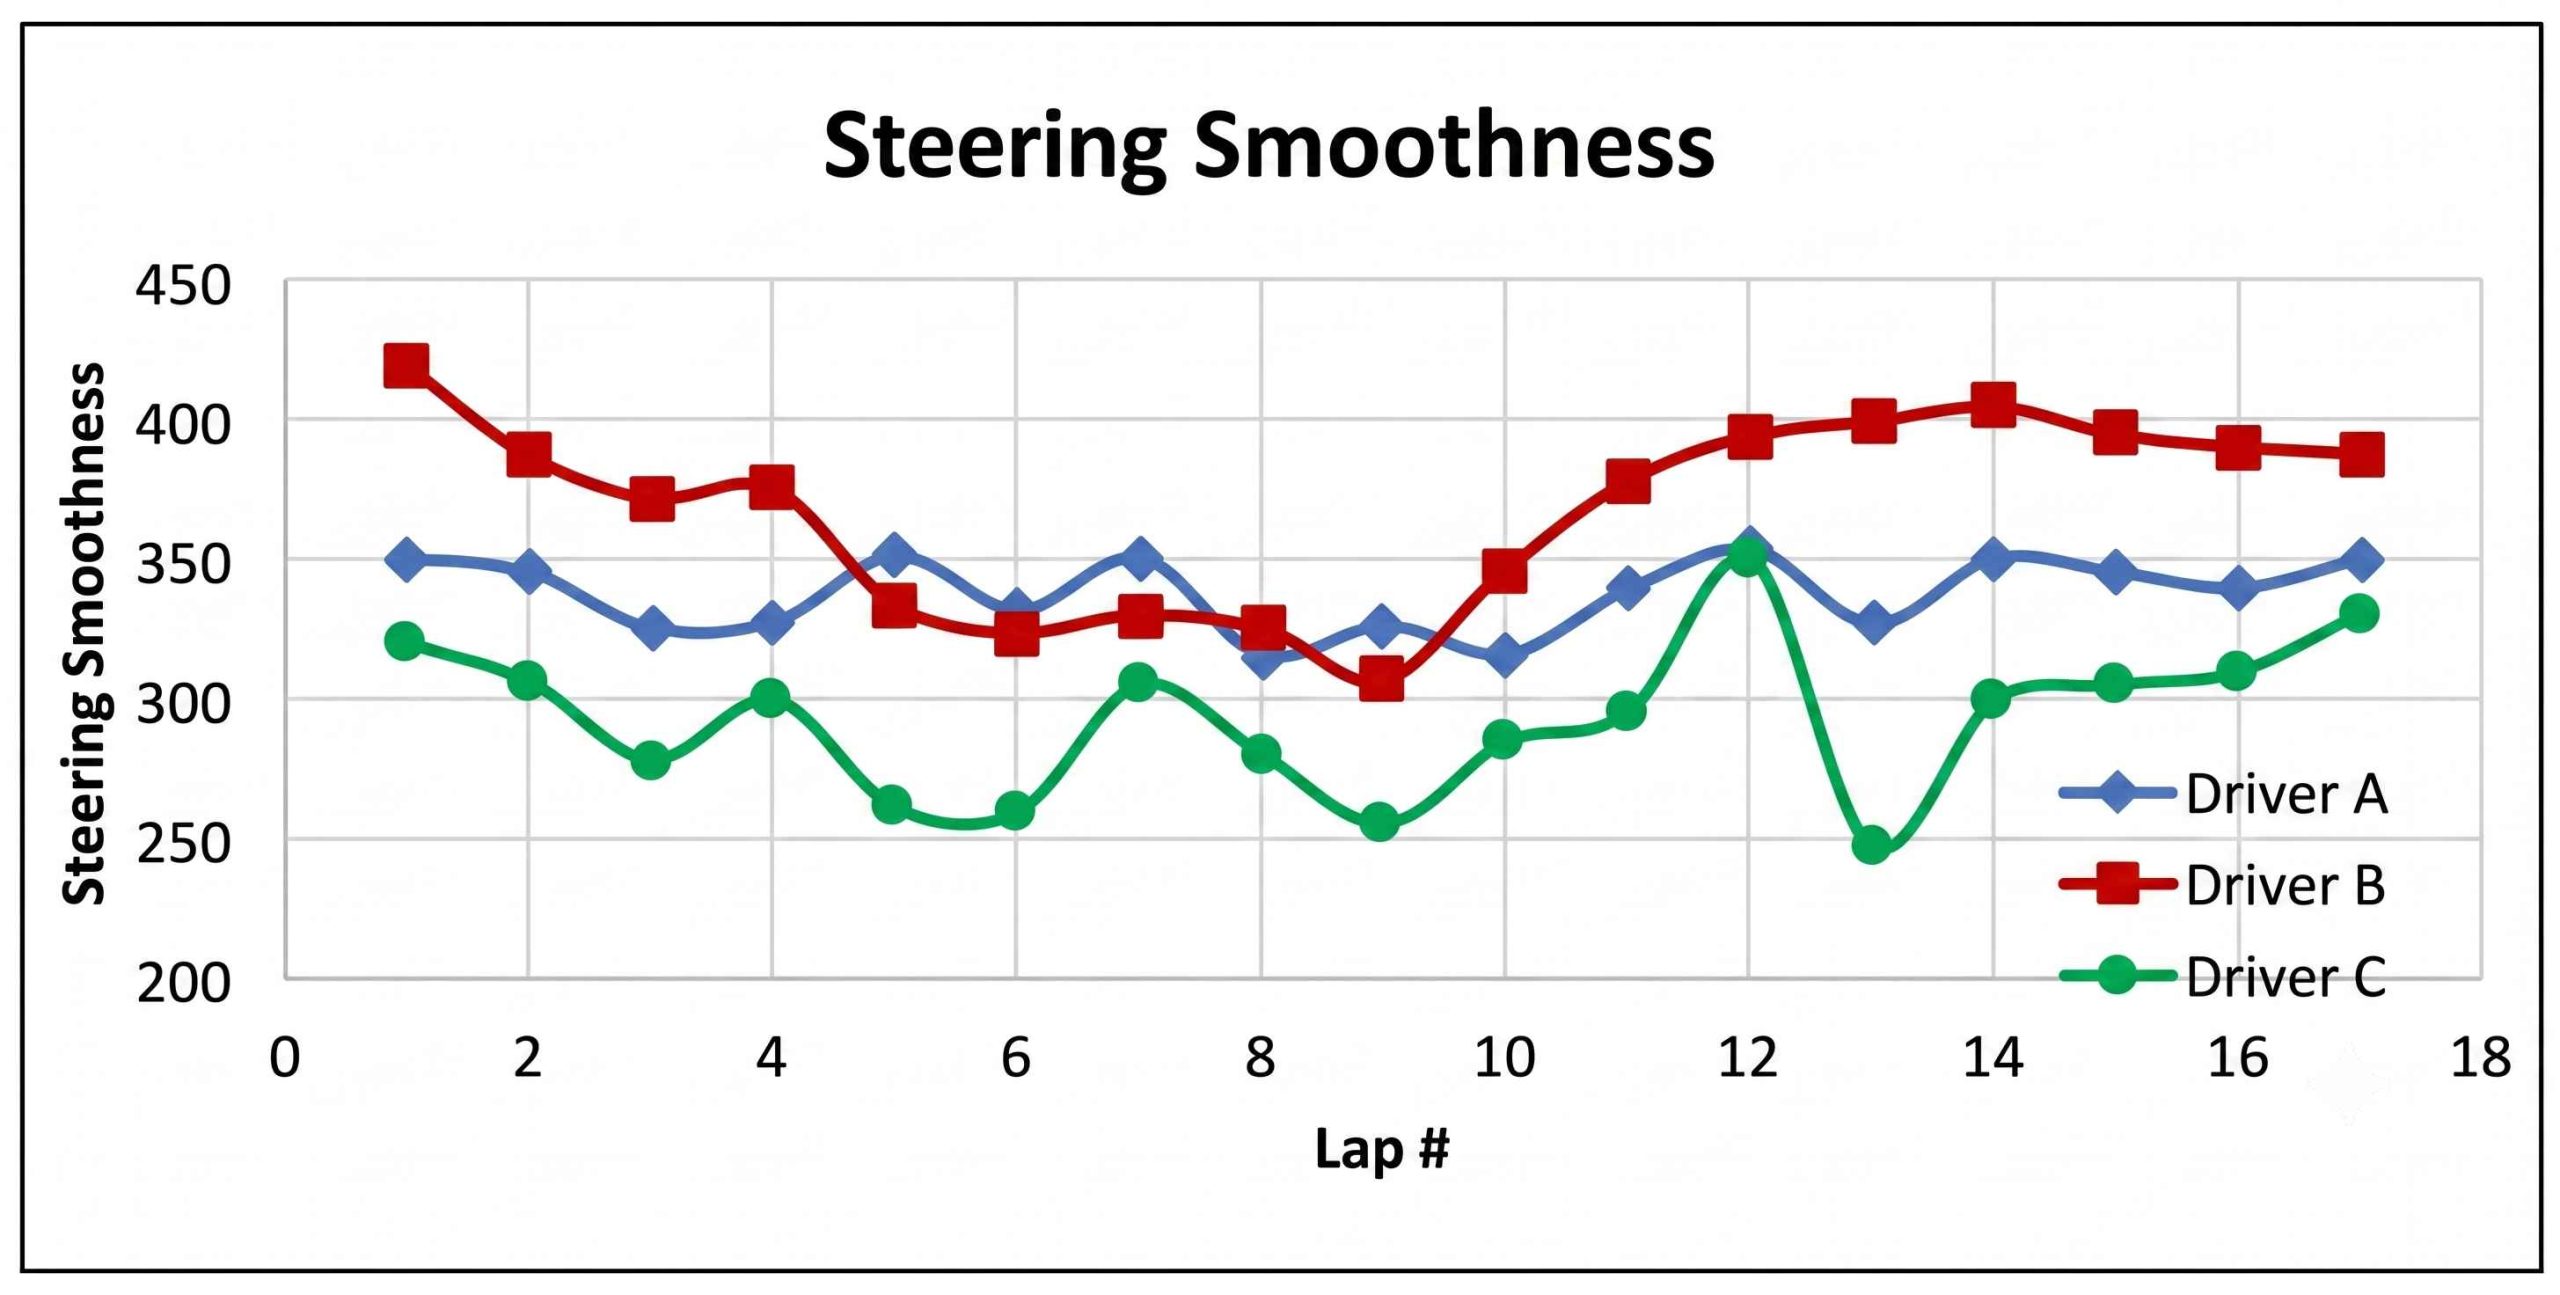
The difference between this chart and the previous one is that we get an idea of how the steering smoothness progresses as the race session goes on. Based on this value, we could also see how the steering smoothness evolves as tyre degradation progresses.
Noticeable points are that each driver's fastest laps (Driver A, lap seven; Driver B, lap nine; and Driver C, lap six) are among the laps where the steering smoothness value is low. From the initial laps until lap nine, all of the drivers are becoming smoother, but after this, all of the drivers start to be less smooth, which could be due to tyre wear.
Data Acquisition is used to monitor and better understand the data we are working with. The value is not in what is measured but in what can be done with the measured data. There are many ways to display what is measured and to obtain metrics. The trick is to find what works best for you and your team.
The steering smoothness KPI is an example of a metric that can be used to quantify the steering smoothness of the race driver. It can help the engineer to quickly identify laps or corners of interest.
A great deal of information can be extracted from time/distance charts. In a fast-paced environment, such as professional motorsport, the quick analysis and decision making is fundamental, and we must find a way to improve the speed at which we extract information from our data. KPIs automate the analysis process.
When comparing steering smoothness KPI values there will be situations where the smoothest lap does not correspond to the fastest, or there seems to be no relationship between the steering smoothness and the lap time, which was the case with driver A.
We will return to the subject of a driver's key performance indicators in future issues.


