


Lateral thinking on tire load variations
A seven-post rig is all well and good, but when it comes to lateral and longitudinal tire loads OptimumG engineer Claude Rouelle believes there’s a need for a fresh approach
BY CLAUDE ROUELLE
Download the original PDF from RaceCar Design Magazine!
Tires hate load variations. For a given trajectory, you can’t change the track bumps, tire aerodynamics, dynamic loads from lateral and longitudinal, weight transfers, or even banking on oval circuits. But with good springs, anti-roll bar, and damper settings, you can limit the tyre load variation.
Four, seven, or even eight post rigs are used to qualify and quantify such tyre vertical load variation. That could be a problem; you look not only for less tyre vertical variation but also for less lateral and longitudinal tyre load variation. But a four or seven-post rig won’t give the lateral, longitudinal, self-alignment moment value or disturbance.
A place in the sum
OptimumG performed a test in collaboration with SovaMotion to understand how the variation of the vertical load affects the variation of the lateral force, so we could have a better understanding/correlation of the results from a rig.
When a car is tested on a post rig, the metric used to quantify how much the contact patch load variation and sprung body change is by calculating the root mean square of the vertical load and dividing it by the average vertical load, as shown in Equation 1. Being that the root mean squared (Equation 2) is the root sum of the squares of all the vertical loads applied, divided by the number of vertical loads applied during the test.
We look at this number, from Equation 1, as a percentage load variation of the mean load. Most post-rig engineers will tell you that ‘a lower number is less tyre force variation, hence better tyre grip’. But is it true?
The question that we need to ask ourselves is: If using this metric is true, by how much should we minimise the load variation? Do we want the same amount of load variation reduction front and rear? Is this relationship linear? By minimising the vertical load variation, do we really increase the grip?
Imagine we had a graph of lateral load variation vs vertical load variation. Let’s look
at a simplified and exaggerated numerical example (Figure 1). If we reduce the vertical load variation from 20 per cent to 10 per cent, there won’t be a major lateral load variation. But a variation that goes from 30 per cent to 20 per cent or 40 per cent to 30 per cent of the vertical load has a larger impact on the lateral force consistency.
Also, what if the front and rear tires had a difference Δ Fy Vs Δ Fz? With a rig, we focus on the vertical load variations, but we have little information on lateral load variations. The question we must then answer is: How does the different vertical load variation affect the variation of the lateral force Fy, longitudinal Fx, and self-alignment Mz and camber moment Mx variations?
The questions can also arise if the curve Δ Fy Vs Δ Fz of the front and rear tyre is different, as shown in Figure 2. The same decrease in the vertical load variation on the front and rear tire won’t give the same results as the lateral load variation. These could create, for example, for better or worse, a different yaw moment response to a steer input.
We have a good understanding of the non-linearities of suspension springs and dampers, but not always a good understanding of the stiffness and damping of the tyre itself.
Is it true that a lower number means less tyre force variation?
Figure 1: This is an example of a hypothesis where decreasing the vertical
load variation does not change the lateral force variation in the same way
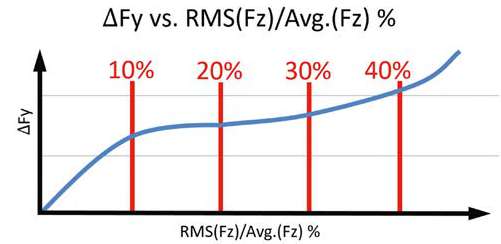
Figure 2: This example shows a hypothesis where it’s the same as Figure 1,
but here it also does not change in the same way at the front and at the rear
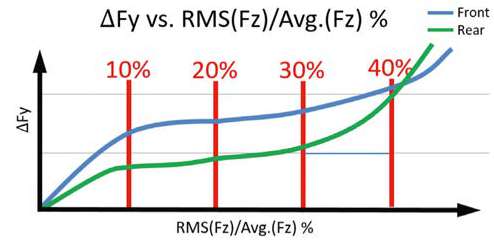
Figure 3 shows the two-stage mass damper quarter car model that is used to simulate the response of the car to the road input.
How non-linear are the tire stiffnesses and damping? Are these tire stiffness and damping speed, camber, vertical load, slip angle, slip ratio, pressure sensitive, and even more vertical load amplitude and frequency sensitive?
Figure 3: The two-stage mass damper quarter car model. But what do we
know about a tyre’s vertical stiffness and damping in real track conditions?
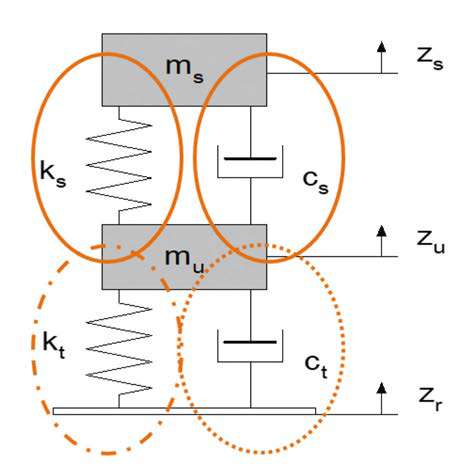
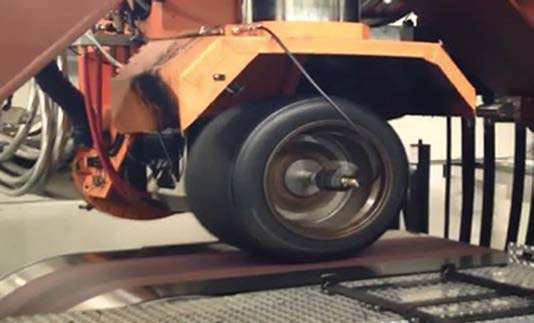
Table 1 summarises the test conducted by OptimumG. In the test, the tyre is steered to a given slip angle and held. We maintained constant static vertical average load (4000N); pressure 1.90bar; speed 40km/h, slip ratio 0 per cent, inclination angle 0deg, slip angle 5deg. During the procedure, the frequency of the vertical load is changed according to Table 1. Figure 4 is a picture of this test.
The test was performed at a low speed of 40km/h because at a higher speed, the tyre temperature variation would be too big, changing the tyre characteristics. The test was aimed at understanding the coupling between vertical load excitation and the generated lateral force, as well as to help comprehend how the vertical stiffness/damping of a tire varies with excitation frequency and amplitude.
Figure 4: The test; the tire is steered to a given slip angle, then held there
Test Limitations
We are aiming to test across the complete matrix in Table 1. The black area was not tested due to the limitations of the machine at the time, since the maximum speed at which the machine can move vertically is 200mm/s. Five tyres were tested based on this matrix in one day. Great improvements on both the hardware and software of the tyre testing machine have been made since that test, to reduce the black area of this table.
Table 1: The frequencies of the loads that are applied to the tire
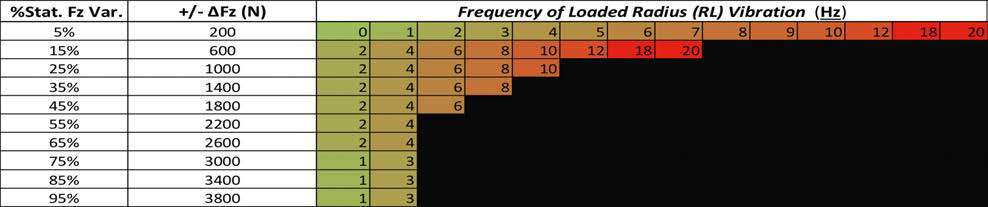
Figure 5 showcases the vertical force variation (as the input applied by the machine) and the lateral force (as the output measured by the machine). Notice the time delay
between the vertical force being applied in the tyre and the tyre generating the lateral force.
Based on the test from Table 1 and Figure 5, Figure 6 is possible. In Figure 6, we are looking at the lateral coefficient of friction (lateral force divided by the vertical force) of the five different tyres tested at different frequency ranges. As described in Equation 1, the metric used in rig tests is only focused on getting a lower number, which would mean a lower vertical load variation and hence better lateral grip.
Figure 5: This shows the vertical force excitation versus the lateral force
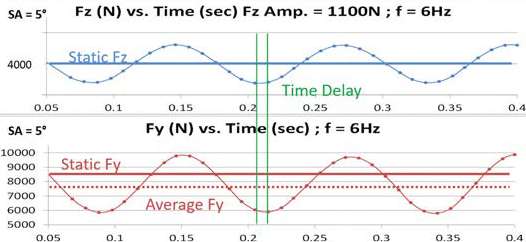
Figure 6: Lateral coefficient of friction versus the different vertical load excitation for the five different tyres. All the tires lose grip with frequency
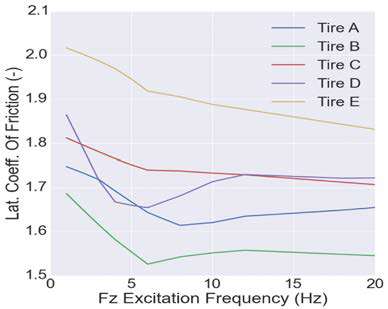
The first observation is that all tires lose grip with frequency. The other observation is that with some of them, like tyres A, B, and D, there is a dip representing a frequency where you do not want to go. And that is often the frequency region of a racecar’s suspended mass.
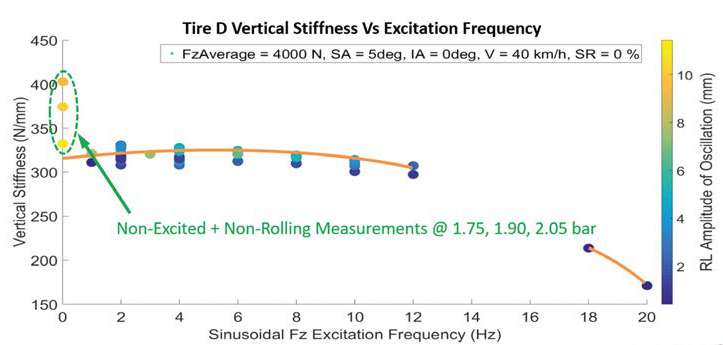
In Figure 7 and Figure 8 for the same conditions applied (average vertical load of 4000N; slip angle of 5deg; inclination angle of 0deg; velocity of 40km/h and a slip ratio of zero per cent) we plotted the tyre vertical stiffness for the range of different vertical load excitation, also coloured with the rolling radius for tyres A and D. Tyres A and D have a similar vertical stiffness but as the frequency increases you can see that the vertical stiffness for tire A increases while tyre D decreases. The tyre stiffness is an important parameter to consider for the calculation of your dynamic ride height, and as the frequency changes, the tire stiffness varies. With this in mind, a correction of the static ride height and/or the suspension spring stiffness would be needed. We can also see that at 0Hz (the tyre is not moving), for different pressures, the tire stiffness changes, and the higher the pressure, the stiffer it is, but as you start exciting the tire, the vertical stiffness changes. In the case of tire D at 20Hz (a bumpy track), the tire stiffness decreases to half.
Figure 7: Vertical tyre stiffness vs excitation frequency for tyre A. This has a similar vertical stiffness to D, below
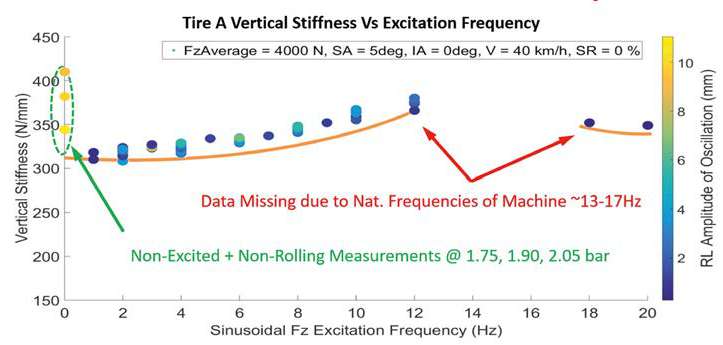
Figure 8: Vertical stiffness vs excitation frequency for tyre D. The stiffness decreases as the frequency increases
It’s important to consider tire stiffness when calculating your dynamic ride height
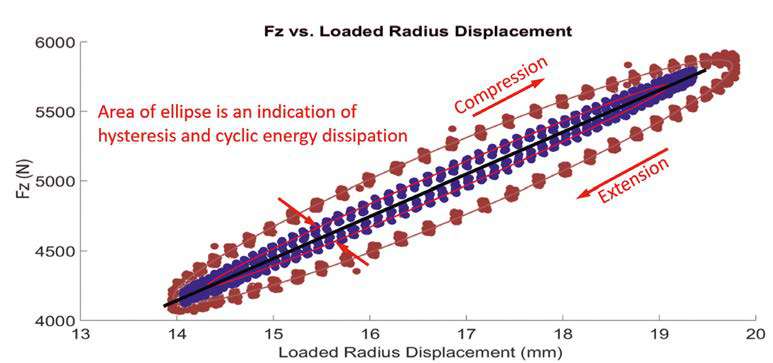
Figure 9 shows the vertical load versus displacement for one of the tires for two different frequencies but the same amplitude. In blue is a frequency of 2Hz and in red a frequency of 6Hz. We can clearly see that as the frequency changes, the damping of the tire changes a lot, and at higher frequency, its hysteresis is bigger, when compared with low frequency.
Figure 9: Frequency of 2Hz is shown in blue and 6Hz is shown in red. Note the changes in the damping of the tire
New Models
We are pioneering an approach to useful transient tire testing and applying new models in vehicle dynamic studies. This test paves the way to new tyre frequency response analysis and is a possible application to four and seven-post rig testing.
From this test, it has been observed that there is a frequency range in which some tyres lose grip quicker than in other parts of the excitation spectrum, shown in Figure 6. From the tire vertical excitation test, we can conclude that the metric used to quantify the contact patch load variation and sprung body change doesn’t necessarily translate to a better performance of the racecar on the track. It can be seen that there is a frequency range in which the tire loses grip more quickly than in the other parts of the excitation spectrum.
The tyre vertical stiffness changes with vertical load variation, and depending on the tire, it can either increase or decrease. This is actually an important value to consider for any racecars running with aerodynamics, because it will affect the dynamic ride height.


